How to Present Real-Time Vital Signs in the Provider Video Interface
Learn how to design a real-time vital signs provider video interface that enhances clinical decision-making without increasing cognitive load for telehealth platforms.
The integration of camera-based vital signs into telehealth platforms has moved from a technical proof-of-concept to a live engineering challenge. For telehealth CTOs and VPs of Engineering, the question is no longer if vitals can be captured during a video visit, but how they should be presented to the provider. The wrong interface design can negate the clinical benefits of the data, overwhelming clinicians and adding to their already significant cognitive load. An effective real-time vital signs provider video interface must balance data richness with the human factors of clinical communication, ensuring that this new stream of information clarifies, rather than complicates, the virtual encounter.
"A 2020 study published in the Journal of Medical Internet Research found that physicians spend an average of 1.77 hours daily on documentation after hours, a workload often referred to as 'pajama time'. This highlights the critical need for new clinical tools to be exceptionally efficient and intuitive."
Designing the real-time vital signs provider video interface
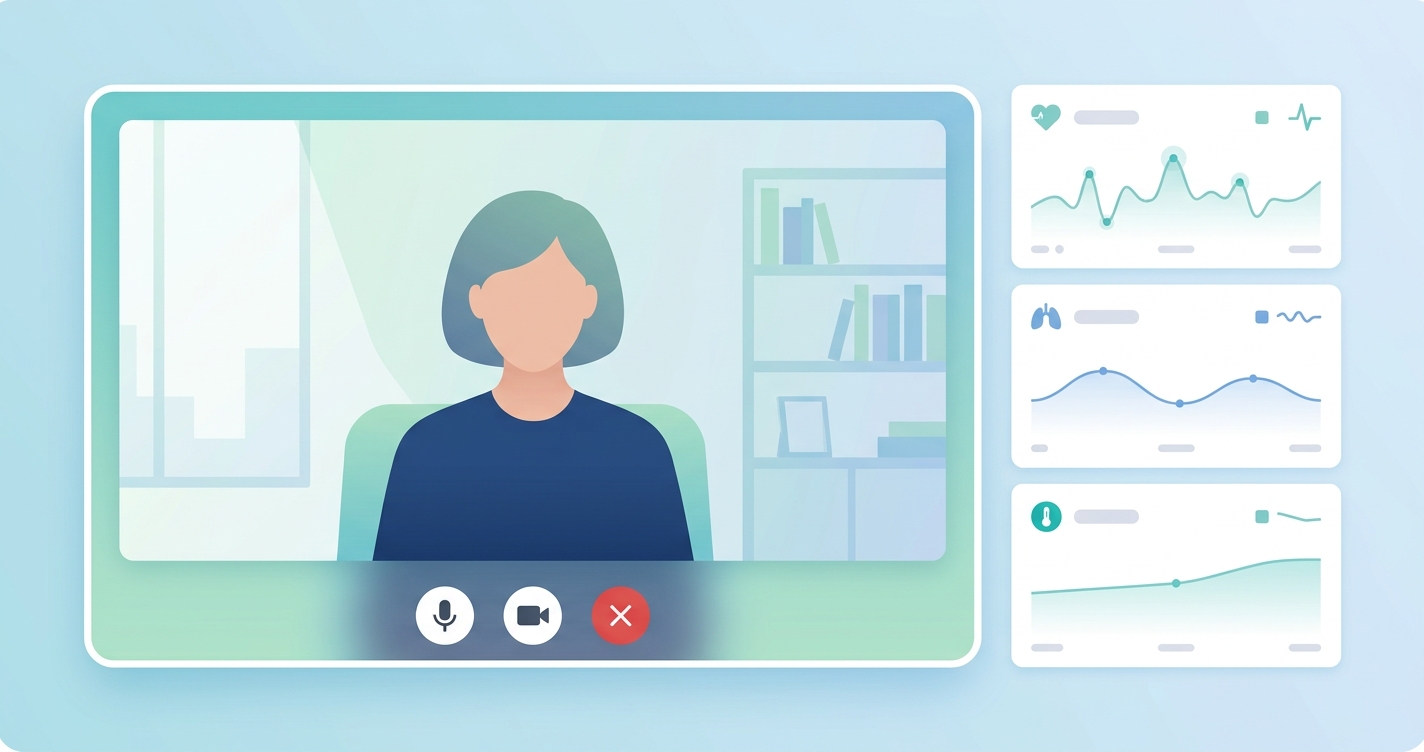
The primary goal of a real-time vital signs provider video interface is to enhance, not interrupt, the clinical conversation. The provider's attention is a finite resource, split between listening to the patient, observing visual cues, and navigating the electronic health record (EHR). Adding a constant stream of numerical data without careful design risks creating a distraction that undermines the core value of the visit.
Human-computer interaction (HCI) research provides a strong foundation for this work. Studies in high-stakes data environments, such as ICU monitoring, offer valuable parallels. Research by Hravnak et al. (2018) on ICU dashboards emphasizes the need for user-centered design that prioritizes simplicity and clarity. The key is to present data in a way that supports rapid pattern recognition. For a telehealth interface, this means abstracting raw data into clinically meaningful insights. Instead of just showing "Heart Rate: 78 bpm," an interface might show a stable trend line or a subtle, color-coded indicator that signifies the reading is within the patient's normal range. This approach, known as progressive disclosure, reduces cognitive load by showing only what is necessary and allowing the provider to drill down for more detail if required.
| Display Method | Description | Pros | Cons | | :--- | :--- | :--- | :--- | | Persistent Overlay | A small, semi-transparent window or bar that is always visible, displaying key vitals as numerical readouts or sparklines. | Data is always available at a glance; no user action needed to view. | Can be distracting; may obscure parts of the patient video; contributes to visual clutter. | | On-Demand Pane | A hidden sidebar or panel that the provider can open with a click or hover. | Minimizes distraction during conversation; allows for richer data display (e.g., historical trends) when opened. | Requires an extra user action; vitals are not passively monitored. | | Ambient Indicator | A subtle visual cue, such as a colored dot or a pulsing ring around the patient's video feed, that changes based on vitals stability. | Extremely low cognitive load; integrates directly into the visual focus area. | Lacks specificity; requires the provider to query the system for detailed numbers. | | Episodic Snapshot | Vitals are captured at a specific point in the visit (e.g., during intake) and presented as a static block of data. | Simple to implement; provides a baseline measurement for the record. | Does not provide real-time feedback or trend data throughout the call. |
Interface models for telehealth platforms
The optimal design for a real-time vital signs provider video interface depends on the clinical use case. Different care models have different requirements for data density and immediacy.
The "cockpit" model for acute care and triage
For use cases like virtual urgent care or emergency triage, providers need dense, immediately accessible information, much like an ICU physician. Here, a hybrid model often works best:
- A persistent overlay showing the most critical vitals (e.g., heart rate, respiration rate).
- An on-demand pane that provides deeper context, including trend graphs and baseline comparisons.
- Color-coded alerts for readings that fall outside of preset or dynamically generated parameters.
The "ambient" model for chronic care management
In chronic care, the focus is on long-term trends, not second-to-second fluctuations. The interface should reflect this by running in the background.
- An ambient indicator can provide passive reassurance that vitals are stable.
- The system can be configured to alert the provider only if a significant deviation from the patient's historical trend is detected.
- Data is primarily reviewed in a separate dashboard outside the live video call, focusing on week-over-week or month-over-month changes.
The "snapshot" model for routine follow-ups
For routine primary care or behavioral health visits, a full real-time stream may be unnecessary.
- A simple "Capture Vitals" button can initiate a 30-60 second reading at the start of the visit.
- The results are displayed as a static snapshot that can be easily copied into the visit notes.
- This provides a verifiable, objective data point for the encounter with minimal intrusion.
Current research and evidence
The evidence base for telehealth interface design is growing rapidly. A 2022 systematic review in the Journal of the American Medical Informatics Association (JAMIA) analyzing clinician burnout identified EHR usability and information overload as major contributors. While not focused on video interfaces directly, the findings highlight the principle that any new data stream must be thoughtfully integrated to avoid adding to the burden. Research from the Nielsen Norman Group on cognitive load in user experience design, while not specific to healthcare, provides validated frameworks for measuring the mental effort required to use an interface. They recommend minimizing choices, establishing a clear visual hierarchy, and using familiar design patterns to reduce the learning curve for new tools. In the context of telehealth, this means making the vitals display look and feel like a natural extension of the video platform, not a bolted-on feature.
The future of clinical data presentation in telehealth
Looking ahead, the presentation of real-time vital signs will become more intelligent and context-aware. Instead of relying on the provider to interpret raw data, platforms will use AI to synthesize it. An AI layer could analyze incoming rPPG data and present a summary like, "Blood pressure is trending 5% higher than the 4-week average, with a slight increase during the conversation." This moves the interface from data presentation to clinical decision support.
Furthermore, the interface will become more adaptive. It might automatically switch from an ambient mode to a more detailed "cockpit" view if the system detects an anomaly, guiding the provider's attention precisely when it's needed. This allows clinicians to stay focused on the patient, confident that the platform is monitoring conditions in the background and will surface insights intelligently.
Frequently asked questions
Q: What is the most important factor in designing a real-time vital signs provider video interface? A: The most critical factor is minimizing cognitive load. The interface must present vital, actionable information without distracting the provider from the patient conversation. This means prioritizing simplicity, clarity, and user-centered design principles.
Q: Should the telehealth platform display the patient's vitals to the patient as well? A: This is a key design consideration with trade-offs. Displaying vitals can increase patient engagement and health literacy. However, for some, seeing real-time fluctuations can cause anxiety. A common solution is to make patient-side display optional and configurable by the provider.
Q: How does low bandwidth affect the display of real-time vitals? A: This is a crucial technical consideration for any telehealth platform. The interface should be designed for graceful degradation. In low-bandwidth scenarios, the system might reduce the data refresh rate (e.g., from every second to every 5 seconds) or temporarily switch from a live trend graph to a static numerical display to ensure the video and audio streams remain stable.
The challenge of presenting real-time vital signs is not just a design problem; it's a critical component of delivering safer and more effective virtual care. As telehealth platforms evolve, the ability to integrate these data streams in a way that empowers, rather than overwhelms, providers will be a key differentiator. Circadify is at the forefront of this space, providing the underlying rPPG SDK that makes this data capture possible, and partnering with telehealth companies to build the next generation of clinically intelligent provider interfaces. To learn more about adding these capabilities to your platform, explore our custom build options. circadify.com/custom-builds